You can preview a given table and access statistics about selected columns in the table. If you've manipulated the data set using any of the select, preparation, column operation, join, machine learning, or scripting nodes, you can view a preview of the table with the given operation or function applied.
Note: By default, the preview is limited to 50 rows for performance reasons. You can increase the preview size if you need to, but this is not recommended since it may increase the preview loading time. For more information, see Configuring the preview size (below).
Previewing Tables
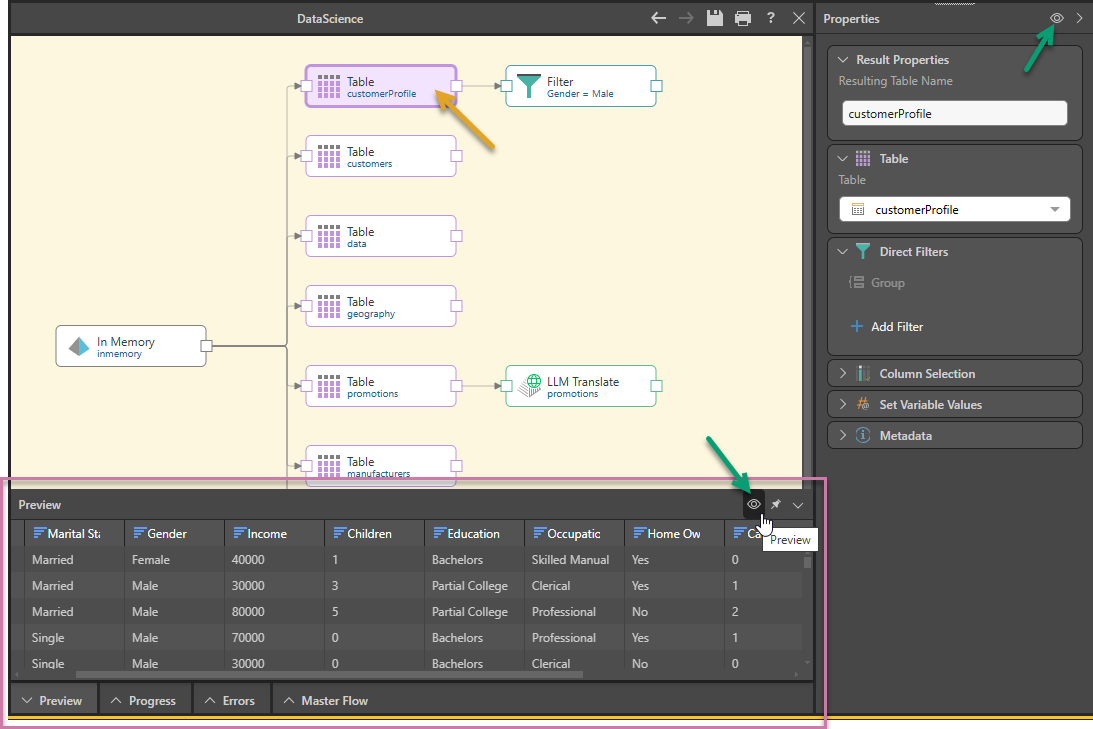
The result set of each table can be previewed by selecting the Table node on the canvas, and then clicking Preview from the node's Properties panel or from the Preview panel itself (green arrows below). By default, the preview is limited to the first 50 rows, but this can be changed using the Preview Size dropdown list.
Accessing a Table preview from the node
The preview panel can be accessed by selecting the Table node on the canvas and doing one of the following:
- Clicking the Preview icon from the Properties panel for the selected Table node.
- Clicking the Preview icon in the Preview pane at the bottom of the page.
You can refresh the preview in either the Properties panel or the Preview panel by clicking the Preview icon again.
Accessing a Table preview from the data source
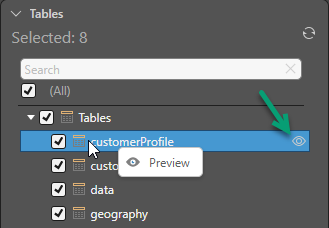
If you have a data source on your canvas, and you want to preview its tables before you add the Table nodes onto the canvas, you can select the Data Source node on the canvas and, from the Tables section on the Properties panel:
- Right-click a table name to open the Preview context menu.
- Hover over the table name to open the Preview icon in line with the Table name (green arrow below).
Either action opens the standard table Preview at the bottom of the page.
Configuring the Preview Size
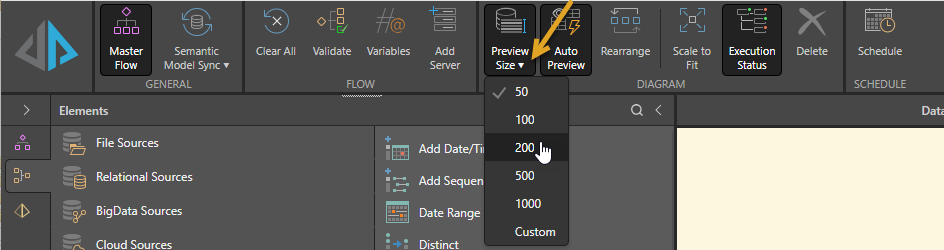
By default, the preview displays the first 50 rows in the table. The preview size can be changed from the Data Flow ribbon. Either click the Preview Size dropdown list and select a preset value or click Custom to customize the preview from the Set Preview Size dialog.
Set Preview Size dialog
You might want to customize the preview size if you want to set a sample fetch size that is larger than the preview size. This is useful if you've added certain nodes to the table, like filters, joins, or summarize.
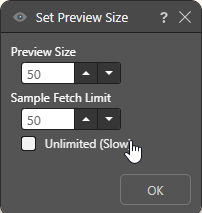
For example, you may have added the filter 'salary > $100,000' to a table. If you then preview that filtered table, and the first 50 rows did not contain the filter condition of salary above $100,000, the preview will be empty. But if you increase the sample fetch limit to 300, the system will fetch the first 300 rows in the source and return the first 50 rows where the filter condition is met.
Customize the preview size by setting the following preferences:
- Preview Size: The number of rows to be included in the preview.
- Sample Fetch Limit: The number of rows fetched from the source to create the preview.
- Unlimited: Enable to allow the system to continue the sample fetch until the given number of rows meeting the condition are found. Be aware that this can be very slow.
Sort and Filter Preview Columns
Hover over a column header to show sorting and filtering options (red arrow below):
- Click the arrows once to sort the preview of the given column in alphabetical order, or twice to sort in reverse-alphabetical order. Click a third time to undo sorting.
- Click the funnel icon to filter the preview of the given column.

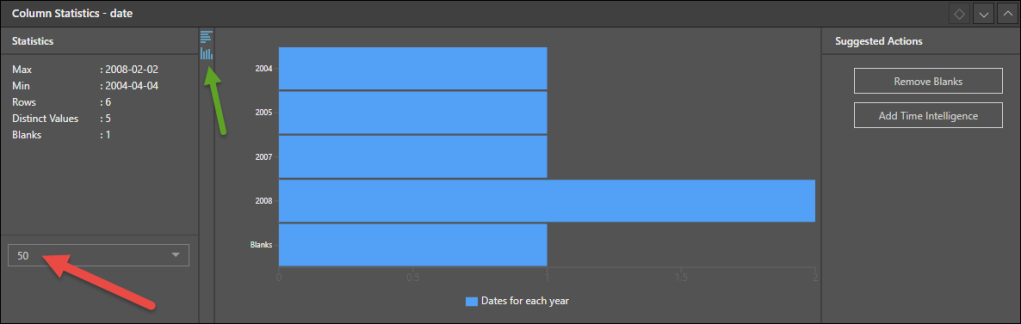
View Column Statistics
Note: This feature is not available in the Community edition.
Click a column's bar chart icon (green arrow above) to open its Column Statistics panel, where you'll see a breakdown of statistics, including the number of rows, distinct values, blanks, and so on.
- Click here to learn more about Column Statistics.